Page 203 - nhms2016 maternal and child findings
P. 203

189
                                                National Health And Morbidity Survey 2016 : Maternal And Child Health (MCH)  Volume II : Findings


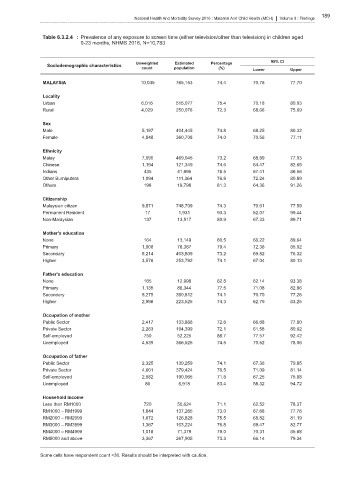
                Table 6.3.2.4 : Prevalence of any exposure to screen time (either television/other than television) in children aged
                             0-23 months, NHMS 2016, N=10,783


                                                                                                95% CI
                                                 Unweighted   Estimated    Percentage
                  Sociodemographic characteristics
                                                   count      population      (%)         Lower        Upper
                MALAYSIA                          10,045       765,153       74.4         70.76        77.70

                Locality
                Urban                              6,016       515,077       75.4         70.18        80.03
                Rural                              4,029       250,076       72.3         68.66        75.69

                Sex
                Male                               5,197       404,445       74.8         68.25        80.32
                Female                             4,848       360,708       74.0         70.56        77.11

                Ethnicity
                Malay                              7,090       469,045       73.2         68.89        77.03
                Chinese                            1,194       121,349       74.6         64.47        82.65
                Indians                             435        41,695        78.5         67.41        86.56
                Other Bumiputera                   1,094       111,364       76.8         72.24        80.89
                Others                              198        19,798        81.3         64.36        91.26

                Citizenship
                Malaysian citizen                  9,871       748,709       74.3         70.61        77.59
                Permanent Resident                  17          1,931        93.3         52.07        99.44
                Non-Malaysian                       137        13,517        80.9         67.33        89.71

                Mother's education
                None                                164        13,149        80.5         66.22        89.64
                Primary                            1,008       76,367        79.4         72.36        85.02
                Secondary                          5,214       403,809       73.2         69.82        76.32
                Higher                             3,576       253,792       74.1         67.04        80.13

                Father's education
                None                                165        12,998        82.8         62.14        93.38
                Primary                            1,135       86,344        77.5         71.08        82.86
                Secondary                          5,275       390,812       74.1         70.70        77.26
                Higher                             2,996       223,525       74.3         62.79        83.25

                Occupation of mother
                Public Sector                      2,417       133,886       72.6         66.68        77.80
                Private Sector                     2,263       194,399       72.1         61.58        80.62
                Self-employed                       750        52,225        86.7         77.57        92.42
                Unemployed                         4,539       366,525       74.5         70.52        78.06

                Occupation of father
                Public Sector                      2,325       139,259       74.1         67.36        79.85
                Private Sector                     4,601       379,424       76.5         71.09        81.14
                Self-employed                      2,582       190,065       71.8         67.25        75.88
                Unemployed                          86          6,918        83.4         58.32        94.72

                Household income
                Less than RM1000                    720        50,624        71.1         62.52        78.37
                RM1000 – RM1999                    1,844       137,265       73.0         67.68        77.76
                RM2000 – RM2999                    1,672       126,828       75.5         68.82        81.19
                RM3000 – RM3999                    1,367       103,224       76.8         69.47        82.77
                RM4000 – RM4999                    1,018       71,379        79.0         70.31        85.68
                RM5000 and above                   3,367       267,905       73.3         66.14        79.34

               Some cells have respondent count <30. Results should be interpreted with caution.
   198   199   200   201   202   203   204   205   206   207   208