
Page 199 - nhms2016 maternal and child findings
P. 199
185
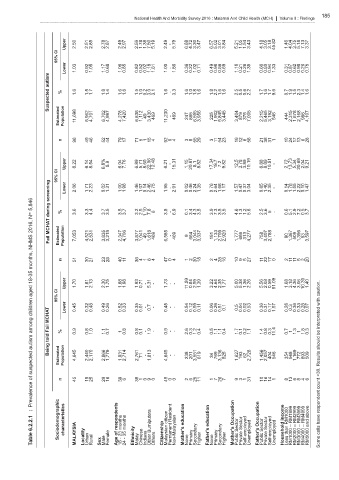
National Health And Morbidity Survey 2016 : Maternal And Child Health (MCH) Volume II : Findings
Upper 2.50 2.51 2.85 2.78 2.87 2.49 2.97 2.59 1.78 1.38 7.50 5.19 2.49 - 5.79 6.88 4.72 3.30 3.47 6.57 5.02 3.01 3.84 5.21 1.05 1.54 3.43 4.18 3.05 3.18 45.82 1.46 4.04 3.75 5.18 7.13 3.37
95% CI
Lower 1.03 0.92 1.05 1.17 0.68 1.06 0.85 0.82 0.52 0.02 1.18 1.81 1.00 - 1.86 0.36 0.22 1.02 0.71 0.49 0.98 0.86 0.69 1.18 0.21 0.26 1.35 0.66 0.80 0.94 1.33 0.31 0.87 0.62 0.98 0.26 0.75
autism
Suspected % 1.6 1.5 1.7 1.8 1.4 1.6 1.6 1.5 1.0 0.2 3.0 3.1 1.6 - 3.3 1.6 1.0 1.8 1.6 1.8 2.2 1.6 1.6 2.5 0.5 0.6 2.2 1.7 1.6 1.7 9.6 0.7 1.9 1.5 2.3 1.4 1.6
Estimated Population 11,698 6,962 4,701 6,702 4,997 4,278 7,420 6,638 1,112 49 3,430 469 11,230 - 469 247 865 6,595 3,956 225 1,902 5,845 3,445 3,404 879 375 7,005 2,215 5,465 3,192 546 444 2,315 1,678 2,168 986 4,107
n 96 49 46 52 44 79 17 71 5 1 15 4 92 0 4 3 8 55 29 3 11 54 23 19 12 6 58 21 38 31 1 10 24 17 13 6 26
Upper 6.22 6.14 8.54 6.8% 8.9 6.04 7.76 6.89 5.71 8.60 22.06 12.48 6.21 - 15.31 1.15 20.87 8.1 8.82 17.34 18.7 7.2 9.82 12.5 3.78 3.89 10.19 6.88 8.89 10.51 - 2.72 13.73 5.34 20.69 2.04 9.21
95% CI
screening Lower 2.06 1.71 2.23 0.02 1.31 1.00 1.98 1.46 1.07 0.14 2.46 2.75 1.95 - 2.91 0.02 0.46 2.24 1.35 0.76 2.64 1.68 1.17 1.57 0.47 0.37 3.04 0.85 1.40 2.35 - 0.14 1.78 1.55 2.22 0.10 1.47
5,846 during
N= % 3.6 3.3 4.4 3.7 3.5 3.5 3.7 3.2 2.5 1.10 7.8 6 3.5 - 6.9 0.1 3.4 4.3 3.5 3.9 7.3 3.5 3.5 4.6 1.3 1.2 5.6 2.5 3.6 5 - 0.6 5.1 2.9 7.2 0.5 3.7
2016, MCHAT
NHMS Fail Estimated Population 7,053 4,521 2,531 3,835 3,218 2,347 4,706 3,877 1,041 49 1,618 469 6,585 - 469 9 664 3,044 3,337 191 1,133 2,709 2,920 1,777 686 313 4,277 758 3,407 2,788 - 90 1,367 509 1,396 93 3,597
months, n 51 30 21 23 28 40 11 36 4 1 6 4 47 0 4 1 2 30 18 2 4 28 16 10 9 5 27 11 22 17 0 2 11 11 5 2 20
18-35 Upper 1.70 1.81 2.13 2.30 1.75 1.88 1.98 1.93 0.71 - 5.31 - 1.73 - - 11.59 0.84 2.59 1.39 3.22 4.64 2.35 1.77 5.00 5.38 1.36 2.26 5.56 2.08 0.59 51.09 1.68 3.18 4.36 3.06 10.30 1.40
aged 95% CI caution.
children MCHAT Lower 0.45 0.32 0.48 0.49 0.26 0.52 0.33 0.35 0.01 - 0.7 - 0.45 - - 0.54 0.12 0.59 0.11 0.06 0.26 0.51 0.1 0.5 0.04 0.02 0.53 0.36 0.31 0.17 1.57 0.28 0.3 0.36 0.33 0.28 0.07 with
among Fail % 0.9 0.8 1.0 1.1 0.7 1 0.8 0.8 0.1 - 1.9 - 0.9 - - 2.6 0.3 1.2 0.4 0.5 1.1 1.1 0.4 1.7 0.1 0.2 1.1 1.4 0.8 0.3 11.4 0.7 1 1.3 1 1.8 0.3 interpreted be
autism told Being should
suspected Estimated Population 4,645 2,440 2,170 2,866 1,779 1,931 2,714 2,761 71 - 1,813 - 4,645 - - 238 201 3,551 619 34 769 3,136 525 1,627 193 62 2,728 1,456 2,057 404 546 354 948 1,169 772 893 509 Results
of n 45 19 25 29 16 39 6 35 1 0 9 0 45 0 0 2 6 25 11 1 7 26 7 9 3 1 31 10 16 14 1 8 13 6 8 4 6 <30. count
Prevalence respondent
: respondents Resident education education Occupation Occupation income RM1000 RM1999 RM2999 RM3999 RM4999 above
6.2.2.1 Sociodemographic characteristics months months Bumiputera citizen Non-Malaysian Sector Sector Self-employed Sector Sector Self-employed than – – – – and have cells
Table MALAYSIA Locality Urban Rural Sex Male Female of Age 23 - 18 35 - 24 Ethnicity Malay Chinese Indians Other Others Citizenship Malaysian Permanent Mother's None Primary Secondary Higher Father's None Primary Secondary Higher Mother's Public Private Unemployed Father's Public Private Unemployed Household Less RM1000 RM2000 RM3000 RM4000 RM5000 Some