Page 200 - nhms2016 maternal and child findings
P. 200

186
          National Health And Morbidity Survey 2016 : Maternal And Child Health (MCH)  Volume II : Findings


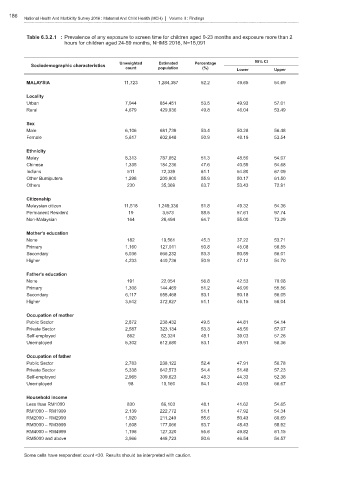
          Table 6.3.2.1 : Prevalence of any exposure to screen time for children aged 0-23 months and exposure more than 2
                        hours for children aged 24-59 months, NHMS 2016, N=15,091


                                                                                           95% CI
                                           Unweighted    Estimated   Percentage
            Sociodemographic characteristics
                                             count       population     (%)         Lower        Upper
          MALAYSIA                           11,723      1,284,387      52.2        49.65        54.69

          Locality
          Urban                              7,044       854,451        53.5        49.93        57.01
          Rural                              4,679       429,936        49.8        46.04        53.49

          Sex
          Male                               6,106       681,739        53.4        50.28        56.48
          Female                             5,617       602,648        50.9        48.19        53.54

          Ethnicity
          Malay                              8,313       787,652        51.3        48.50        54.07
          Chinese                            1,335       184,236        47.6        40.59        54.68
          Indians                             511         72,339        61.1        54.80        67.09
          Other Bumiputera                   1,298       200,900        55.9        50.17        61.50
          Others                              230         35,369        63.7        53.43        72.91

          Citizenship
          Malaysian citizen                  11,518      1,249,336      51.8        49.32        54.36
          Permanent Resident                  19          3,573         88.5        57.61        97.74
          Non-Malaysian                       164         28,494        64.7        55.00        73.29

          Mother's education
          None                                182         19,561        45.3        37.22        53.71
          Primary                            1,160       127,011        50.8        45.08        56.55
          Secondary                          6,036       666,232        53.3        50.59        56.01
          Higher                             4,233       440,736        50.9        47.12        54.70

          Father's education
          None                                191         22,054        56.8        42.53        70.08
          Primary                            1,306       144,469        51.2        46.90        55.56
          Secondary                          6,117       658,468        53.1        50.18        56.05
          Higher                             3,542       372,627        51.1        46.15        56.04

          Occupation of mother
          Public Sector                      2,872       236,432        49.5        44.81        54.14
          Private Sector                     2,587       323,134        53.3        48.50        57.97
          Self-employed                       862         82,324        48.1        39.03        57.26
          Unemployed                         5,302       612,680        53.1        49.91        56.36

          Occupation of father
          Public Sector                      2,783       238,122        52.4        47.91        56.78
          Private Sector                     5,338       642,573        54.4        51.48        57.23
          Self-employed                      2,965       309,623        48.3        44.33        52.38
          Unemployed                          98          10,160        54.1        40.93        66.67

          Household income
          Less than RM1000                    830         86,103        48.1        41.62        54.65
          RM1000 – RM1999                    2,139       222,772        51.1        47.92        54.34
          RM2000 – RM2999                    1,920       211,249        55.6        50.43        60.69
          RM3000 – RM3999                    1,608       177,066        53.7        48.43        58.92
          RM4000 – RM4999                    1,196       127,320        55.6        49.82        61.15
          RM5000 and above                   3,966       448,723        50.6        46.54        54.57

          Some cells have respondent count <30. Results should be interpreted with caution.
   195   196   197   198   199   200   201   202   203   204   205