Page 206 - nhms2016 maternal and child findings
P. 206

192
          National Health And Morbidity Survey 2016 : Maternal And Child Health (MCH)  Volume II : Findings


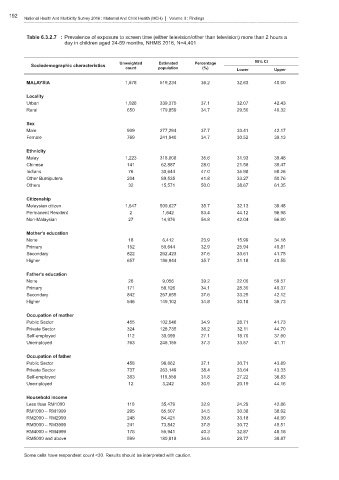
          Table 6.3.2.7 : Prevalence of exposure to screen time (either television/other than television) more than 2 hours a
                        day in children aged 24-59 months, NHMS 2016, N=4,401


                                                                                           95% CI
                                           Unweighted    Estimated   Percentage
            Sociodemographic characteristics
                                             count       population     (%)         Lower        Upper
          MALAYSIA                           1,678       519,234        36.2        32.63        40.00

          Locality
          Urban                              1,028       339,375        37.1        32.07        42.43
          Rural                               650        179,859        34.7        29.50        40.32

          Sex
          Male                                909        277,294        37.7        33.41        42.17
          Female                              769        241,940        34.7        30.52        39.13

          Ethnicity
          Malay                              1,223       318,608        35.6        31.93        39.48
          Chinese                             141         62,887        28.0        21.58        35.47
          Indians                             76          30,644        47.0        35.98        58.26
          Other Bumiputera                    204         89,535        41.8        33.27        50.76
          Others                              32          15,571        50.0        38.67        61.35

          Citizenship
          Malaysian citizen                  1,647       500,627        35.7        32.13        39.48
          Permanent Resident                   2          1,642         83.4        44.12        96.98
          Non-Malaysian                       27          14,976        54.8        42.04        66.90

          Mother's education
          None                                18          6,412         23.9        15.99        34.18
          Primary                             152         50,644        32.9        25.94        40.81
          Secondary                           822        262,423        37.6        33.61        41.75
          Higher                              657        186,944        35.7        31.18        40.55

          Father's education
          None                                26          9,056         39.2        22.00        59.57
          Primary                             171         58,126        34.1        28.30        40.37
          Secondary                           842        267,655        37.6        33.25        42.12
          Higher                              546        149,102        34.8        30.18        39.73

          Occupation of mother
          Public Sector                       455        102,546        34.9        28.71        41.73
          Private Sector                      324        128,735        38.2        32.11        44.70
          Self-employed                       112         30,099        27.1        18.70        37.60
          Unemployed                          763        246,155        37.3        33.57        41.11

          Occupation of father
          Public Sector                       458         98,862        37.1        30.71        43.89
          Private Sector                      737        263,149        38.4        33.64        43.33
          Self-employed                       383        119,558        31.8        27.22        36.83
          Unemployed                          12          3,242         30.9        20.19        44.16

          Household income
          Less than RM1000                    110         35,479        32.9        24.29        42.86
          RM1000 – RM1999                     295         85,507        34.5        30.38        38.92
          RM2000 – RM2999                     248         84,421        39.8        33.18        46.90
          RM3000 – RM3999                     241         73,842        37.8        30.72        45.51
          RM4000 – RM4999                     178         55,941        40.3        32.87        48.18
          RM5000 and above                    599        180,818        34.6        29.77        39.87

          Some cells have respondent count <30. Results should be interpreted with caution.
   201   202   203   204   205   206   207   208   209   210   211