
Page 205 - nhms2016 maternal and child findings
P. 205
191
National Health And Morbidity Survey 2016 : Maternal And Child Health (MCH) Volume II : Findings
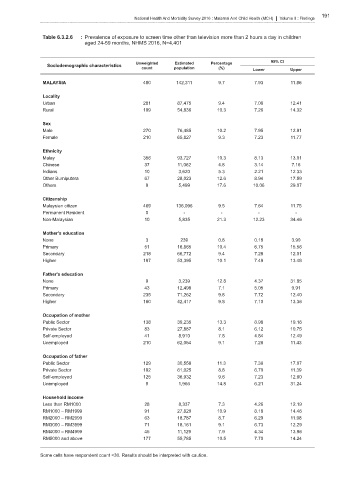
Table 6.3.2.6 : Prevalence of exposure to screen time other than television more than 2 hours a day in children
aged 24-59 months, NHMS 2016, N=4,401
95% CI
Unweighted Estimated Percentage
Sociodemographic characteristics
count population (%) Lower Upper
MALAYSIA 480 142,311 9.7 7.93 11.86
Locality
Urban 281 87,475 9.4 7.08 12.41
Rural 199 54,836 10.3 7.26 14.32
Sex
Male 270 76,485 10.2 7.95 12.91
Female 210 65,827 9.3 7.23 11.77
Ethnicity
Malay 356 93,727 10.3 8.13 13.01
Chinese 37 11,062 4.8 3.14 7.16
Indians 10 3,620 5.3 2.21 12.33
Other Bumiputera 67 28,023 12.6 8.94 17.59
Others 9 5,499 17.6 10.06 29.07
Citizenship
Malaysian citizen 469 136,096 9.5 7.64 11.75
Permanent Resident 0 - - - -
Non-Malaysian 10 5,835 21.3 12.23 34.46
Mother's education
None 3 239 0.8 0.18 3.90
Primary 51 16,865 10.4 6.75 15.56
Secondary 218 66,772 9.4 7.28 12.01
Higher 197 53,395 10.1 7.49 13.48
Father's education
None 9 3,239 12.8 4.37 31.85
Primary 43 12,498 7.1 5.05 9.91
Secondary 235 71,262 9.8 7.72 12.40
Higher 160 42,417 9.8 7.10 13.36
Occupation of mother
Public Sector 138 39,235 13.3 8.98 19.16
Private Sector 83 27,887 8.1 6.12 10.75
Self-employed 41 8,910 7.8 4.84 12.49
Unemployed 210 62,054 9.1 7.26 11.43
Occupation of father
Public Sector 129 30,558 11.3 7.36 17.07
Private Sector 192 61,025 8.8 6.70 11.39
Self-employed 125 36,932 9.6 7.23 12.60
Unemployed 5 1,966 14.8 6.21 31.24
Household income
Less than RM1000 28 8,337 7.3 4.26 12.19
RM1000 – RM1999 91 27,820 10.9 8.18 14.46
RM2000 – RM2999 63 18,787 8.7 6.29 11.98
RM3000 – RM3999 71 18,161 9.1 6.73 12.29
RM4000 – RM4999 45 11,129 7.9 4.34 13.96
RM5000 and above 177 55,785 10.5 7.70 14.24
Some cells have respondent count <30. Results should be interpreted with caution.