
Page 209 - nhms2016 maternal and child findings
P. 209
195
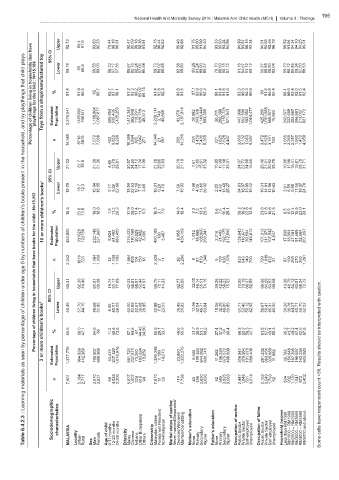
National Health And Morbidity Survey 2016 : Maternal And Child Health (MCH) Volume II : Findings
Upper 92.73 93.4 91.9 93.83 92.23 70.44 98.18 98.61 92.47 95.59 98.18 92.36 91.91 92.75 96.44 94.82 95.46 92.88 91.75 95.80 91.99 94.40 93.33 93.63 93.24 94.56 94.99 93.97 96.15 92.34 94.91 93.65 92.46 96.79 90.52 91.94 94.34 94.10 94.25 95.01
plays toy 95% CI
child Lower 89.78 90 88.8 89.58 89.00 56.33 97.17 97.35 89.67 86.76 92.24 87.06 85.58 89.73 86.02 88.65 82.38 89.80 80.29 91.24 88.90 89.27 79.70 88.50 90.18 87.12 91.16 84.67 91.72 89.12 90.37 88.85 88.80 83.04 85.10 86.72 89.85 89.34 87.50 88.53
that shop/manufactured 91.4 91.9 90.5 90.7 63.7 97.7 98.1 91.2 92.3 96.2 90.02 89.15 91.4 92.8 92.3 90.8 91.5 87.1 93.9 90.6 92.2 88.1 91.4 91.8 91.6 93.3 90.3 94.3 90.9 91.6 90.8 92.4 88.1 89.6 92.4 92.0 91.5 92.4
playthings Percentage of children living in households that have playthings for the child : N=15,188 a % 92 93
by from Estimated Population 2,276,541 1480395 796147 1,188,864 1,087,677 305,853 535,435 1,435,253 1,412,343 363,848 116,291 329,719 49,513 2,229,114 3,749 40,695 43,978 2,187,814 38,582 243,328 1,143,448 803,350 36,211 262,388 1,150,725 671,941 447,908 552,506 163,952 1,064,477 425,260 1,091,588 589,877 19,962 242,677 332,689 353,867 306,681 211,067 827,172
and Toys
household, n 14,580 8710 5870 7,572 7,008 422 9,859 4,299 10,309 1,694 625 1,642 271 14,340 21 197 255 14,215 231 1,459 7,430 5,309 221 1,625 7,528 4,467 3,660 3,132 1,063 6,587 3,472 6,528 3,751 124 1,550 2,269 2,357 1,960 1,472 4,958
the Upper 21.03 22.7 15.8 21.39 21.36 4.45 13.78 29.81 20.57 34.25 24.12 17.34 11.09 21.29 25.96 12.83 25.78 21.19 7.61 12.85 15.61 33.32 10.85 11.99 17.48 33.31 34.07 22.72 34.96 15.65 28.46 21.01 20.92 38.79 10.66 11.96 15.41 19.81 28.79 31.71
in
present 95% CI Lower 15.79 18.7 12.3 15.04 16.05 0.77 9.26 22.88 15.50 22.53 12.18 7.75 3.49 16.01 0.29 4.79 7.59 15.92 0.66 4.09 11.48 26.02 2.85 4.62 13.48 25.27 24.81 16.07 13.95 10.42 19.31 14.91 12.96 10.63 3.91 6.58 9.88 11.96 18.07 24.76
books books 1
children's children's % 18.3 20.6 13.9 18.0 18.6 1.9 11.3 26.2 17.9 28.0 17.4 11.7 6.3 18.5 3.1 7.9 14.5 18.4 2.3 7.3 13.4 29.5 5.6 7.5 15.4 29.1 29.2 19.2 22.8 12.8 23.6 17.8 16.6 21.5 6.5 8.9 12.4 15.5 23.0 28.1
of more or Estimated Population 453,806 331620 122186 232,146 221,660 8,924 61,482 383,400 276,422 110,160 20,829 42,902 3,490 450,189 126 3,487 6,955 439,109 1,012 18,968 168,955 256,341 2,316 21,493 192,175 212,956 139,643 116,871 39,504 149,812 107,312 211,072 107,542 4,547 17,939 33,053 47,181 51,489 52,664 251,097
numbers 10
by n 2,342 1619 723 1,184 1,158 12 1,138 1,192 1,664 405 104 150 18 2,328 2 36 2,290 9 87 879 1,346 9 109 938 1,179 933 543 149 700 729 1,019 472 21 87 169 259 270 265 1,291
5 11
age Percentage of children living in households that have books for the child : N=15,113
under Upper 60.31 62.30 49.40 61.07 60.08 19.74 51.17 77.69 62.03 68.51 68.87 52.44 41.97 60.75 70.11 44.33 62.77 60.85 32.08 46.14 55.51 74.15 39.26 42.22 58.23 75.02 70.55 70.19 66.07 52.55 66.66 64.29 53.53 69.58 40.38 46.79 54.12 63.81 68.04 72.72 caution.
children 95% CI with
of books 1 Lower 50.49 57.70 44.70 48.68 51.85 6.05 40.07 69.05 52.00 51.89 52.57 36.68 26.85 50.88 7.07 23.53 36.45 50.82 13.95 32.04 46.71 63.84 18.06 32.38 49.80 60.89 61.77 53.45 50.12 42.96 56.67 50.41 45.31 40.00 30.26 36.78 44.27 50.77 56.70 62.02 interpreted
percentage children's % 55.5 60.0 47.1 54.9 56 11.2 45.6 73.6 57.1 60.5 61 44.42 34.00 55.9 29.7 33.1 49.6 55.9 21.7 38.9 51.1 69.2 27.4 37.2 54 68.4 66.3 62.2 58.3 47.7 61.8 57.5 49.4 55.3 35.2 41.7 49.2 57.4 62.5 67.6 be
by more should
seen or Estimated Population 1,377,776 964,826 412,950 708,807 668,969 53,479 247,320 1,076,976 881,721 237,871 73,260 162,624 18,859 1,359,248 1,199 14,573 23,860 1,333,279 9,566 100,383 644,082 600,741 11,262 106,330 675,572 499,899 316,847 378,954 101,075 558,406 281,232 683,451 320,889 11,662 96,782 154,646 187,395 190,937 143,234 603,920 Results
as 3
materials n 7,901 5,184 2,717 3,970 3,931 68 4,524 3,309 5,837 1,007 324 615 94 7,810 11 63 114 7,738 43 496 3,650 3,636 52 585 3,825 3,083 2,447 1,846 531 3,014 2,163 3,549 1,793 62 524 932 1,120 1,041 873 3,402 <30. count
Learning respondent
:
6.4.2.3 Sociodemographic characteristics Other Bumiputera Malaysian citizen Permanent Resident Marital status of mother Never married/Separated/ Divorced/Widowed Married/Cohabiting Mother's education Father's education Occupation of mother Occupation of father Household income Less than RM1000 RM1000 – RM1999 RM2000 – RM2999 RM3000 – RM3999 RM4000 – RM4999 RM5000 and above have cells
Table MALAYSIA Locality Urban Rural Sex Male Female Age of child 0-11 months 12-23 months 24-59 months Ethnicity Malay Chinese Indians Others Citizenship Non-Malaysian None Primary Secondary Higher None Primary Secondary Higher Public Sector Private Sector Self-employed Unemployed Public Sector Private Sector Self-employed Unemployed Some