
Page 193 - nhms2016 maternal and child findings
P. 193
179
National Health And Morbidity Survey 2016 : Maternal And Child Health (MCH) Volume II : Findings
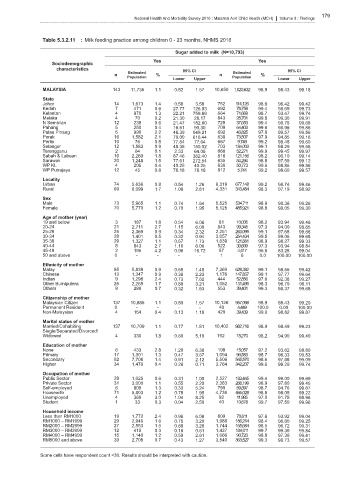
Table 5.3.2.11 : Milk feeding practice among children 0 - 23 months, NHMS 2016
Sugar added to milk (N=10,793)
Yes Yes
Sociodemographic
characteristics 95% CI 95% CI
Estimated Estimated
n % n %
Population Population
Lower Upper Lower Upper
MALAYSIA 143 11,735 1.1 0.82 1.57 10,650 1,020,632 98.9 98.43 99.18
State
Johor 14 1,673 1.4 0.58 3.58 752 114,126 98.6 96.42 99.42
Kedah 7 471 0.6 27.77 126.93 692 78,759 99.4 98.69 99.73
Kelantan 4 970 1.3 22.21 759.89 664 71,669 98.7 93.47 99.74
Melaka 4 70 0.2 21.30 28.17 843 28,701 99.8 99.30 99.91
N Sembilan 12 238 0.6 21.47 182.60 725 37,653 99.4 98.78 99.68
Pahang 5 250 0.4 16.51 90.30 709 64,403 99.6 98.96 99.86
Pulau Pinang 5 990 2.2 48.39 949.21 692 43,825 97.8 89.57 99.56
Perak 16 1,582 2.1 70.00 616.44 638 73,507 97.9 94.85 99.16
Perlis 10 76 0.8 77.64 77.64 667 9,749 99.2 98.48 99.60
Selangor 12 1,583 0.9 48.36 150.02 703 184,003 99.1 98.29 99.58
Terengganu 2 64 0.1 2.33 64.06 666 52,271 99.9 99.45 99.97
Sabah & Labuan 16 2,269 1.8 87.46 382.40 816 121,156 98.2 96.10 99.14
Sarawak 20 1,248 1.5 77.61 272.54 635 84,294 98.5 97.59 99.12
WP KL 4 205 0.4 40.25 40.25 636 50,773 99.6 98.86 99.86
WP Putrajaya 12 45 0.8 78.18 78.18 812 5,741 99.2 98.60 99.57
Locality
Urban 74 5,636 0.8 0.54 1.26 6,319 677,148 99.2 98.74 99.46
Rural 69 6,099 1.7 1.08 2.81 4,331 343,484 98.3 97.19 98.92
Sex
Male 73 5,965 1.1 0.74 1.64 5,525 534,711 98.9 98.36 99.26
Female 70 5,770 1.2 0.70 1.95 5,125 485,921 98.8 98.05 99.30
Age of mother (year)
19 and below 3 187 1.8 0.54 6.06 81 10,005 98.2 93.94 99.46
20-24 21 2,711 2.7 1.15 6.00 843 99,345 97.3 94.00 98.85
25-29 25 2,369 0.9 0.34 2.32 2,251 263,099 99.1 97.68 99.66
30-34 28 1,401 0.5 0.32 0.94 3,057 254,434 99.5 99.06 99.68
35-39 29 1,327 1.1 0.67 1.73 1,639 121,861 98.9 98.27 99.33
40-44 8 843 2.7 1.16 6.06 522 30,609 97.3 93.94 98.84
45-49 2 195 4.2 0.96 16.72 57 4,417 95.8 83.28 99.04
50 and above 0 - - - - 1 6 0.0 100.00 100.00
Ethnicity of mother
Malay 85 5,839 0.9 0.58 1.45 7,369 629,392 99.1 98.55 99.42
Chinese 13 1,347 0.9 0.36 2.23 1,176 147,837 99.1 97.77 99.64
Indian 9 1,298 2.4 0.73 7.62 444 52,856 97.6 92.38 99.27
Other Bumiputera 25 2,265 1.7 0.89 3.21 1,052 131,499 98.3 96.79 99.11
Others 9 289 0.7 0.32 1.63 553 39,401 99.3 98.37 99.68
Citizenship of mother
Malaysian Citizen 137 10,885 1.1 0.80 1.57 10,126 957,098 98.9 98.43 99.20
Permanent Resident 0 - - - - 48 4,449 100.0 0.00 100.00
Non-Malaysian 4 154 0.4 0.13 1.18 420 39,439 99.6 98.82 99.87
Marital status of mother
Married/Cohabiting 137 10,709 1.1 0.77 1.51 10,402 982,716 98.9 98.49 99.23
Single/Separated/Divorced/
Widowed 4 330 1.8 0.60 5.10 192 18,270 98.2 94.90 99.40
Education of mother
None 6 433 2.8 1.20 6.38 198 15,057 97.2 93.62 98.80
Primary 17 1,301 1.3 0.47 3.67 1,094 96,583 98.7 96.33 99.53
Secondary 82 7,708 1.4 0.91 2.12 5,506 545,570 98.6 97.88 99.09
Higher 34 1,476 0.4 0.26 0.71 3,764 342,207 99.6 99.29 99.74
Occupation of mother
Public Sector 28 1,025 0.6 0.31 1.00 2,527 183,445 99.4 99.00 99.69
Private Sector 31 3,000 1.1 0.55 2.20 2,383 268,199 98.9 97.80 99.45
Self-employed 6 809 1.3 0.33 5.24 790 59,897 98.7 94.76 99.67
Housewife 71 5,803 1.2 0.78 1.95 4,736 465,028 98.8 98.05 99.22
Unemployed 4 369 3.0 1.04 8.25 92 11,995 97.0 91.75 98.96
Student 1 33 0.3 0.04 2.50 40 10,678 99.7 97.50 99.96
Household income
Less than RM1000 19 1,772 2.4 0.96 6.08 809 70,611 97.6 93.92 99.04
RM1000 – RM1999 29 2,946 1.6 0.75 3.20 1,988 186,214 98.4 96.80 99.25
RM2000 – RM2999 27 2,553 1.5 0.69 3.28 1,744 165,684 98.5 96.72 99.31
RM3000 – RM3999 12 415 0.3 0.16 0.61 1,437 134,011 99.7 99.39 99.84
RM4000 – RM4999 15 1,140 1.2 0.59 2.61 1,066 90,723 98.8 97.39 99.41
RM5000 and above 39 2,708 0.7 0.43 1.27 3,540 363,527 99.3 98.73 99.57
Some cells have respondent count <30. Results should be interpreted with caution.