
Page 190 - nhms2016 maternal and child findings
P. 190
176
National Health And Morbidity Survey 2016 : Maternal And Child Health (MCH) Volume II : Findings
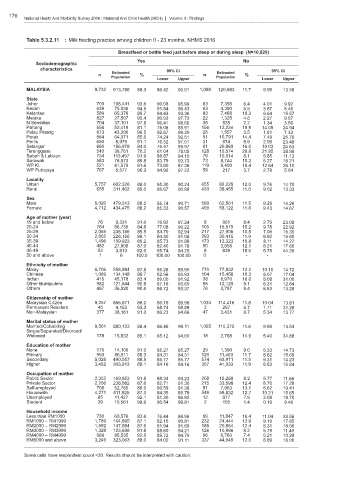
Table 5.3.2.11 : Milk feeding practice among children 0 - 23 months, NHMS 2016
Breastfeed or bottle feed just before sleep or during sleep (N=10,820)
Yes No
Sociodemographic
characteristics 95% CI 95% CI
Estimated Estimated
n % n %
Population Population
Lower Upper Lower Upper
MALAYSIA 9,732 913,788 88.3 86.42 90.01 1,088 120,683 11.7 9.99 13.58
State
Johor 703 108,441 93.6 90.08 95.99 63 7,358 6.4 4.01 9.92
Kedah 639 75,036 94.5 91.54 96.43 63 4,390 5.5 3.57 8.46
Kelantan 589 65,379 89.7 84.43 93.36 83 7,488 10.3 6.64 15.57
Melaka 827 27,507 95.4 90.93 97.73 22 1,325 4.6 2.27 9.07
N Sembilan 704 37,101 97.8 96.41 98.66 35 835 2.2 1.34 3.59
Pahang 558 52,419 81.1 75.06 85.91 156 12,234 18.9 14.09 24.94
Pulau Pinang 673 43,290 96.5 92.67 98.39 25 1,557 3.5 1.61 7.33
Perak 564 64,371 85.6 74.24 92.51 91 10,791 14.4 7.49 25.76
Perlis 650 8,979 91.1 76.52 97.01 31 874 8.9 2.99 23.48
Selangor 660 156,978 84.0 75.47 89.97 61 29,880 16.0 10.03 24.53
Terengganu 540 36,761 70.2 61.04 78.05 128 15,574 29.8 21.95 38.96
Sabah & Labuan 754 113,497 91.9 88.87 94.15 79 10,014 8.1 5.85 11.13
Sarawak 583 76,873 89.8 83.79 93.73 73 8,744 10.2 6.27 16.21
WP KL 521 41,579 81.6 73.90 87.36 119 9,400 18.4 12.64 26.10
WP Putrajaya 767 5,577 96.3 94.96 97.22 59 217 3.7 2.78 5.04
Locality
Urban 5,757 602,326 88.0 85.30 90.24 655 82,228 12.0 9.76 14.70
Rural 655 311,462 89.0 86.67 90.98 433 38,455 11.0 9.02 13.33
Sex
Male 5,020 479,313 88.5 85.74 90.71 589 62,561 11.5 9.29 14.26
Female 4,712 434,475 88.2 85.33 90.57 499 58,122 11.8 9.43 14.67
Age of mother (year)
19 and below 76 9,331 91.6 76.92 97.24 8 861 8.4 2.76 23.08
20-24 764 86,735 84.8 77.08 90.22 105 15,570 15.2 9.78 22.92
25-29 2,065 238,186 89.5 84.70 92.94 217 27,905 10.5 7.06 15.30
30-34 2,802 226,156 88.1 84.40 91.08 293 30,415 11.9 8.92 15.60
35-39 1,496 109,923 89.2 85.73 91.89 173 13,323 10.8 8.11 14.27
40-44 482 27,906 87.9 82.40 91.79 50 3,858 12.1 8.21 17.60
45-49 52 3,813 82.0 55.74 94.25 8 839 18.0 5.75 44.26
50 and above 1 6 100.0 100.00 100.00 0 - - - -
Ethnicity of mother
Malay 6,706 558,994 87.8 85.28 89.90 770 77,832 12.2 10.10 14.72
Chinese 1,089 134,148 89.7 82.96 93.93 104 15,458 10.3 6.07 17.04
Indian 415 45,178 83.4 69.00 91.92 38 8,976 16.6 8.08 31.00
Other Bumiputera 982 121,644 90.9 87.16 93.69 95 12,120 9.1 6.31 12.84
Others 487 36,020 90.6 86.72 93.37 76 3,757 9.4 6.63 13.28
Citizenship of mother
Malaysian Citizen 9,257 855,671 88.2 86.19 89.96 1,033 114,416 11.8 10.04 13.81
Permanent Resident 45 4,153 93.3 68.74 98.89 3 297 6.7 1.11 31.26
Non-Malaysian 377 36,161 91.3 86.23 94.66 47 3,431 8.7 5.34 13.77
Marital status of mother
Married/Cohabiting 9,501 880,153 88.4 86.46 90.11 1,065 115,375 11.6 9.89 13.54
Single/Separated/Divorced/
Widowed 178 15,832 85.1 65.12 94.60 18 2,768 14.9 5.40 34.88
Education of mother
None 175 14,100 91.0 85.27 85.27 29 1,390 9.0 5.33 14.73
Primary 993 86,511 88.3 84.31 84.31 120 11,463 11.7 8.62 15.69
Secondary 5,028 490,057 88.5 85.77 85.77 574 63,971 11.5 9.31 14.23
Higher 3,452 303,913 88.1 84.16 84.16 357 41,033 11.9 8.83 15.84
Occupation of mother
Public Sector 2,352 169,853 91.8 88.34 94.23 208 15,268 8.2 5.77 11.66
Private Sector 2,206 238,082 87.6 82.71 91.30 215 33,598 12.4 8.70 17.29
Self-employed 706 52,760 86.9 80.59 91.38 91 7,953 13.1 8.62 19.41
Housewife 4,271 411,925 87.3 84.35 89.79 549 59,832 12.7 10.21 15.65
Unemployed 85 11,427 92.1 81.30 96.92 12 977 7.9 3.08 18.70
Student 39 10,561 98.6 90.54 99.81 2 150 1.4 0.19 9.46
Household income
Less than RM1000 730 60,576 83.6 76.44 88.96 99 11,847 16.4 11.04 23.56
RM1000 – RM1999 1,789 164,895 87.1 82.15 90.81 232 24,444 12.9 9.19 17.85
RM2000 – RM2999 1,592 147,584 87.6 81.94 91.69 185 20,864 12.4 8.31 18.06
RM3000 – RM3999 1,328 123,698 91.8 88.60 94.21 126 10,996 8.2 5.79 11.40
RM4000 – RM4999 988 85,535 92.6 89.72 94.79 96 6,786 7.4 5.21 10.28
RM5000 and above 3,249 323,063 88.0 84.00 91.11 337 44,045 12.0 8.89 16.00
Some cells have respondent count <30. Results should be interpreted with caution.