
Page 191 - nhms2016 maternal and child findings
P. 191
177
National Health And Morbidity Survey 2016 : Maternal And Child Health (MCH) Volume II : Findings
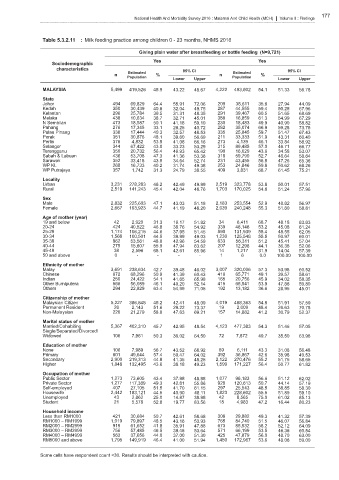
Table 5.3.2.11 : Milk feeding practice among children 0 - 23 months, NHMS 2016
Giving plain water after breastfeeding or bottle feeding (N=9,721)
Yes Yes
Sociodemographic
characteristics 95% CI 95% CI
Estimated Estimated
n % n %
Population Population
Lower Upper Lower Upper
MALAYSIA 5,499 419,526 45.9 43.22 48.67 4,222 493,802 54.1 51.33 56.78
State
Johor 494 69,829 64.4 55.91 72.06 209 38,611 35.6 27.94 44.09
Kedah 350 30,439 40.6 32.04 49.75 287 44,555 59.4 50.25 67.96
Kelantan 296 25,784 39.5 31.31 48.35 291 39,467 60.5 51.65 68.69
Melaka 438 10,634 38.7 32.71 45.01 388 16,859 61.3 54.99 67.29
N Sembilan 473 18,587 50.1 41.18 59.10 230 18,483 49.9 40.90 58.82
Pahang 276 17,345 33.1 26.25 40.72 282 35,074 66.9 59.28 73.75
Pulau Pinang 338 17,444 40.3 32.57 48.53 335 25,845 59.7 51.47 67.43
Perak 351 30,876 48.1 39.60 56.69 211 33,333 51.9 43.31 60.40
Perlis 376 4,832 53.9 41.08 66.16 273 4,139 46.1 33.84 58.92
Selangor 344 67,422 43.0 33.23 53.29 315 89,485 57.0 46.71 66.77
Terengganu 350 20,732 56.4 46.93 65.42 190 16,029 43.6 34.58 53.07
Sabah & Labuan 436 53,708 47.3 41.36 53.36 318 59,790 52.7 46.64 58.64
Sarawak 352 33,418 43.5 34.64 52.74 231 43,455 56.5 47.26 65.36
WP KL 268 16,733 40.2 31.74 49.38 253 24,846 59.8 50.62 68.26
WP Putrajaya 357 1,742 31.3 24.79 38.55 409 3,831 68.7 61.45 75.21
Locality
Urban 3,231 278,283 46.2 42.49 49.99 2,519 323,778 53.8 50.01 57.51
Rural 2,519 141,243 45.4 42.04 48.76 1,703 170,025 54.6 51.24 57.96
Sex
Male 2,832 225,603 47.1 43.03 51.18 2,183 253,554 52.9 48.82 56.97
Female 2,667 193,923 44.7 41.19 48.20 2,039 240,248 55.3 51.80 58.81
Age of mother (year)
19 and below 42 2,920 31.3 16.17 51.82 34 6,411 68.7 48.18 83.83
20-24 424 40,522 46.8 38.76 54.92 339 46,146 53.2 45.08 61.24
25-29 1,174 106,215 44.6 37.95 51.45 890 131,939 55.4 48.55 62.05
30-34 1,568 100,501 44.5 39.99 49.03 1,230 125,548 55.5 50.97 60.01
35-39 862 53,581 48.8 42.96 54.59 633 56,311 51.2 45.41 57.04
40-44 275 15,607 55.9 47.94 63.62 207 12,298 44.1 36.38 52.06
45-49 38 2,596 68.1 42.61 85.96 14 1,217 31.9 14.04 57.39
50 and above 0 - - - - 1 6 0.0 100.00 100.00
Ethnicity of mother
Malay 3,691 238,634 42.7 39.48 46.02 3,007 320,006 57.3 53.98 60.52
Chinese 672 68,296 50.9 41.39 60.43 416 65,771 49.1 39.57 58.61
Indian 250 24,422 54.1 41.65 65.98 165 20,756 45.9 34.02 58.35
Other Bumiputera 566 56,089 46.1 40.20 52.14 415 65,541 53.9 47.86 59.80
Others 294 22,829 63.4 54.99 71.05 192 13,182 36.6 28.95 45.01
Citizenship of mother
Malaysian Citizen 5,227 386,848 45.2 42.41 48.09 4,019 468,363 54.8 51.91 57.59
Permanent Resident 26 2,143 51.6 29.22 73.37 19 2,009 48.4 26.63 70.78
Non-Malaysian 220 21,279 58.8 47.63 69.21 157 14,882 41.2 30.79 52.37
Marital status of mother
Married/Cohabiting 5,367 402,310 45.7 42.95 48.54 4,123 477,383 54.3 51.46 57.05
Single/Separated/Divorced/
Widowed 106 7,961 50.3 36.02 64.50 72 7,872 49.7 35.50 63.98
Education of mother
None 106 7,989 56.7 43.52 68.92 69 6,111 43.3 31.08 56.48
Primary 601 49,644 57.4 50.47 64.02 392 36,867 42.6 35.98 49.53
Secondary 2,900 219,313 44.8 41.35 48.25 2,122 270,476 55.2 51.75 58.65
Higher 1,848 132,495 43.6 38.18 49.23 1,599 171,227 56.4 50.77 61.82
Occupation of mother
Public Sector 1,273 73,605 43.4 37.98 48.88 1,077 96,183 56.6 51.12 62.02
Private Sector 1,277 117,389 49.3 42.81 55.86 928 120,613 50.7 44.14 57.19
Self-employed 407 27,105 51.5 41.70 61.15 297 25,543 48.5 38.85 58.30
Housewife 2,442 183,121 44.5 40.90 48.11 1,823 228,602 55.5 51.89 59.10
Unemployed 43 2,862 25.0 14.87 38.98 42 8,565 75.0 61.02 85.13
Student 21 5,578 52.8 19.77 83.56 18 4,983 47.2 16.44 80.23
Household income
Less than RM1000 421 30,684 50.7 42.61 58.68 308 29,882 49.3 41.32 57.39
RM1000 – RM1999 1,019 79,897 48.5 43.16 53.93 765 84,740 51.5 46.07 56.84
RM2000 – RM2999 919 61,652 41.8 35.91 47.88 673 85,932 58.2 52.12 64.09
RM3000 – RM3999 756 57,485 46.5 39.46 53.64 571 66,199 53.5 46.36 60.54
RM4000 – RM4999 563 37,656 44.0 37.00 51.30 425 47,879 56.0 48.70 63.00
RM5000 and above 1,795 149,919 46.4 41.00 51.94 1,450 172,967 53.6 48.06 59.00
Some cells have respondent count <30. Results should be interpreted with caution.