
Page 185 - nhms2016 maternal and child findings
P. 185
171
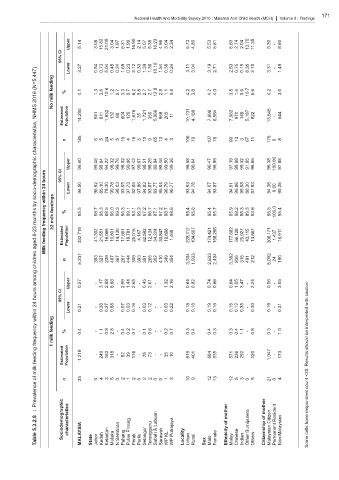
National Health And Morbidity Survey 2016 : Maternal And Child Health (MCH) Volume II : Findings
Upper 5.14 3.08 15.82 21.05 3.04 1.97 6.31 1.99 16.95 2.14 5.07 5.38 16.23 4.96 3.04 2.34 5.73 4.80 5.53 5.81 5.69 2.74 2.04 13.70 11.35 5.30 - 8.60
95% CI
(N=5,447) feeding Lower 3.27 0.54 0.73 5.04 0.45 0.24 1.69 0.23 2.12 0.33 1.39 1.36 10.16 1.54 0.38 0.24 3.11 3.04 3.19 2.71 2.53 0.75 0.15 8.35 2.70 3.31 - 1.49
2016 milk % 4.1 1.3 3.6 10.6 1.2 0.7 3.3 0.7 6.2 0.8 2.7 2.7 12.9 2.8 1.1 0.8 4.2 3.8 4.2 4.0 3.8 1.4 0.6 10.7 5.6 4.2 - 3.6
NHMS No Estimated Population 14,280 541 811 1,932 132 98 604 129 1,676 35 1,721 350 5,066 968 205 11 10,101 4,180 7,696 6,584 7,062 970 149 5,187 822 13,545 - 644
characteristics, n 185 6 5 24 5 5 10 4 15 5 12 9 65 13 4 3 106 79 107 78 90 13 3 67 11 176 0 8
socio-demographic hours 24 95% CI Upper Lower 96.40 94.50 99.46 96.92 98.64 85.10 94.22 78.30 98.32 90.78 99.76 98.03 98.02 93.05 99.66 97.73 97.42 82.85 99.67 97.86 98.51 94.83 98.25 93.87 89.84 83.77 98.46 95.04 99.50 96.79 99.36 96.77 96.58 93.93 96.64 94.78 96.47 94.07 96.99 93.87 97.19 94.01 98.98 96.86 99.32 95.98 91.65 86.30 96.66 87.93 96.38 94.36 100.00 0.00 97.86 90.35
by within feedings
months frequency milk % 95.5 98.7 95.3 88.5 96.0 99.3 96.3 99.1 93.1 99.2 97.2 96.7 87.1 97.2 98.7 98.6 95.4 95.8 95.4 95.7 95.9 98.2 98.3 89.3 93.6 95.5 100.0 95.4
6-23 feeding ≥2 Estimated Population 332,719 41,302 21,551 16,069 10,801 14,139 17,661 18,781 25,015 4,147 62,582 12,434 34,224 33,847 18,696 1,469 228,112 104,607 174,421 158,298 177,682 66,128 25,927 43,115 13,667 308,171 1,437 16,911
aged Milk
children n 5,237 393 327 239 467 367 267 444 309 393 351 265 302 410 349 354 3,304 1,933 2,833 2,404 3,362 836 315 491 212 5,002 24 190
among Upper 0.57 - 3.17 2.88 8.68 - 2.99 1.44 2.65 - 0.45 2.61 - - 1.32 2.16 0.64 0.82 0.74 0.66 0.64 1.05 3.47 - 2.24 0.56 - 3.05
hours 95% CI caution.
24 Lower 0.21 - 0.38 0.27 0.88 - 0.07 0.03 0.16 - 0.03 0.12 - - 0.03 0.22 0.18 0.16 0.19 0.16 0.15 0.12 0.35 - 0.30 0.19 - 0.31 with
within feeding interpreted
frequency milk 1 % 0.4 - 1.1 0.9 2.8 - 0.4 0.2 0.7 - 0.1 0.6 - - 0.2 0.7 0.3 0.4 0.4 0.3 0.3 0.4 1.1 - 0.8 0.3 - 1.0 be should
feeding Estimated Population 1,219 - 249 163 318 - 82 39 176 - 75 73 - - 35 10 819 401 684 535 571 236 292 - 120 1,047 - 173 Results
milk <30.
of n 25 0 4 3 5 0 2 1 2 0 2 2 0 0 1 3 16 9 12 13 12 5 3 0 5 21 0 4 count
Prevalence respondent
: mother mother Citizen Resident
5.3.2.8 Sociodemographic characteristics Sembilan Pinang Labuan & Putrajaya of Bumiputera of Non-Malaysian have cells
Table MALAYSIA State Johor Kedah Kelantan Melaka N Pahang Pulau Perak Perlis Selangor Terengganu Sabah Sarawak KL WP WP Locality Urban Rural Sex Male Female Ethnicity Malay Chinese Indian Other Others Citizenship Malaysian Permanent Some