
Page 220 - nhms2016 maternal and child findings
P. 220
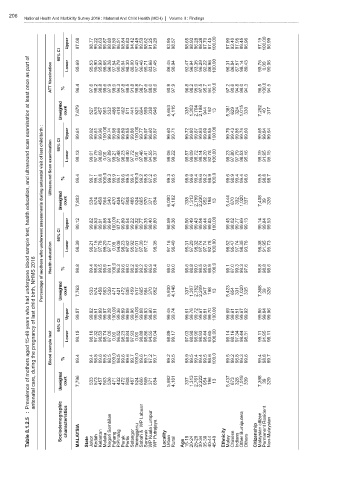
206
          National Health And Morbidity Survey 2016 : Maternal And Child Health (MCH)  Volume II : Findings


                         Upper  97.08  98.77  99.22  99.63  99.87  98.80  99.59  96.51  98.84  99.83  94.42  99.49  99.53  98.62  91.25  99.29  93.95  98.57  98.65  98.93  96.28  98.28  97.70  97.45  100.00  97.90  93.40  97.95  99.45  96.96  97.19  100.00  96.99

                      95% CI
           of
           part          Lower  95.69  95.53  95.90  95.99  98.66  96.26  97.54  90.79  96.04  98.30  88.00  97.40  96.46  95.71  83.66  97.45  86.45  96.94  92.47  96.94  93.35  96.29  92.22  86.96  100.00  96.31  86.84  87.57  98.14  89.43  95.76  0.00  90.06
           as      ATT Vaccination
           once         %    96.4  97.6  98.2  98.8  99.6  97.9  99.0  94.3  97.8  99.5  91.8  98.8  98.7  97.6  88.0  98.6  90.9  97.9  96.8  98.2  95.0  97.5  95.7  94.1  100.0  97.2  90.6  94.8  99.0  94.3  96.5  100.0  94.5

           least

           at          Unweighted  count  7,679  527  576  457  561  532  466  418  462  511  441  521  664  559  338  646  5,653  4,115  335  1,303  2,704  2,188  944  192  13  5,381  629  324  1,015  330  7,292  40  317
           examination   Upper  99.61  99.92  99.61  99.96  100.00  99.74  99.98  99.66  99.89  99.85  99.86  100.00  99.77  99.97  98.60  99.87  99.60  99.71  99.72  99.80  99.67  99.83  99.69  99.85  100.00  99.79  99.43  99.85  99.74  99.60  99.65  99.84  99.64


           scan       95% CI

           ultrasound  Ultrasound Scan examination  Lower  99.13  99.01  97.79  98.69  0.00  97.89  99.21  97.48  98.23  98.40  97.72  0.00  97.46  98.41  94.55  98.37  99.06  99.22  95.57  99.09  98.72  99.14  98.20  92.78  100.00  99.23  97.80  97.79  98.53  95.16  99.19  91.95  95.15


           and          %    99.4  99.7  99.1  99.8  100.0  99.3  99.9  99.1  99.6  99.5  99.4  100.0  99.2  99.8  97.2  99.5  99.3  99.5  98.9  99.6  99.4  99.6  99.2  98.9  100.0  99.6  98.9  99.4  99.4  98.6  99.5  98.8  98.7
           education,  Unweighted  count  7,803  534  574  458  564  540  470  434  472  508  465  524  665  570  371  654  6,000  4,162  338  1,313  2,759  2,230  952  198  13  5,444  670  332  1,020  337  7,408  39  326


           health Percentage of mothers who underwent assessments during antenatal visit of last child birth :  Upper  99.12  99.82  99.53  99.91  99.98  99.64  100.00  97.71  99.89  99.54  99.22  99.32  99.77  99.35  98.40  99.80  98.59  99.36  99.56  99.49  99.43  99.04  99.44  99.85  100.00  99.45  98.02  99.77  99.69  99.13  99.14  99.84  99.53


           test,      95% CI
           sample        Lower  98.39  98.21  97.15  97.78  99.20  97.71  0.00  94.08  98.23  97.62  95.92  97.01  97.30  97.12  98.35  97.16  98.40  95.31  97.20  98.32  97.74  97.74  92.78  100.00  98.52  95.47  97.74  98.35  93.76  98.38  91.95  95.73


           blood  2016  Health education  %  98.8  99.4  98.8  99.5  99.9  99.1  100.0  96.3  99.6  99.0  98.2  98.6  99.2  98.6  96.9  99.4  98.0  99.0  98.6  98.8  99.0  98.5  98.9  98.9  100.0  99.1  97.0  99.3  99.3  97.6  98.8  98.8  98.6

           undergone  NHMS  birth,  Unweighted  count  7,763  533  574  458  563  539  471  421  472  505  459  517  665  564  370  652  5,930  4,148  337  1,307  2,752  2,209  947  198  13  5,423  654  331  1,020  335  7,368  39  326


           had  child
           who  last     Upper  99.57  99.82  99.51  99.89  99.97  99.28  100.00  99.36  99.89  99.89  99.96  100.00  99.88  99.93  98.60  99.91  99.45  99.74  99.61  99.76  99.72  99.67  99.81  99.70  100.00  99.69  99.61  99.51  99.67  99.92  99.56  99.84  99.96
           years  of  95% CI

           15-49  pregnancy  Lower  99.15  98.16  97.32  98.53  98.74  97.00  0.00  96.52  98.23  98.84  97.93  0.00  98.88  98.86  94.55  99.04  98.89  99.17  97.03  98.98  98.90  98.93  98.44  93.65  100.00  99.14  98.16  97.34  98.44  98.31  99.11  91.95  98.11


           aged  the  Blood sample test  %  99.4  99.4  98.8  99.6  99.8  98.5  100.0  98.5  99.6  99.6  99.7  100.0  99.6  99.7  97.2  99.7  99.2  99.5  98.9  99.5  99.4  99.4  99.5  98.6  100.0  99.5  99.2  98.8  99.3  99.6  99.4  98.8  99.7
           mothers  during


           of  care,   Unweighted  count  7,796  533  573  457  563  536  471  432  472  508  467  524  666  569  371  654  5,992  4,161  337  1,313  2,761  2,222  954  196  13  5,437  673  328  1,019  339  7,398  39  329
           Prevalence  antenatal


           :                                       Labuan  Lumpur                            citizen  Resident
           8.1.2.5     Sociodemographic  characteristics  Sembilan  WP  &  Kuala  Putrajaya  Bumiputera  Non-Malaysian

           Table             MALAYSIA  State  Johor  Kedah  Kelantan  Melaka  Negeri  Pahang  P.Pinang  Perak  Perlis  Selangor  Terengganu  Sabah  Sarawak  WP  WP  Locality  Urban  Rural  Age  15-19  20-24  25-29  30-34  35-39  40-44  45-49  Ethnicity  Malay  Chinese  Indians  Other  Others  Citizenship  Malaysian  Permanent