Page 215 - nhms2016 maternal and child findings
P. 215

201
                                                National Health And Morbidity Survey 2016 : Maternal And Child Health (MCH)  Volume II : Findings


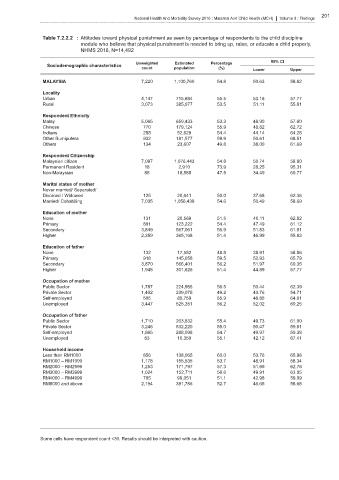
                Table 7.2.2.2 : Attitudes toward physical punishment as seen by percentage of respondents to the child discipline
                             module who believe that physical punishment is needed to bring up, raise, or educate a child properly,
                             NHMS 2016, N=14,492

                                                                                                95% CI
                                                 Unweighted   Estimated    Percentage
                  Sociodemographic characteristics
                                                   count      population      (%)         Lower        Upper
                MALAYSIA                           7,220      1,100,760      54.8         50.63        58.82
                Locality
                Urban                              4,147       715,684       55.5         53.16        57.77
                Rural                              3,073       385,077       53.5         51.11        55.81

                Respondent Ethnicity
                Malay                              5,065       659,433       53.3         48.90        57.60
                Chinese                            770         179,124       55.9         48.82        62.72
                Indians                            288         52,629        54.4         44.14        64.28
                Other Bumiputera                   932         181,577       59.9         50.61        68.51
                Others                             134         23,607        49.8         38.00        61.69

                Respondent Citizenship
                Malaysian citizen                  7,097      1,076,443      54.8         50.74        58.80
                Permanent Resident                  18          2,910        73.9         28.25        95.31
                Non-Malaysian                       85         18,585        47.5         34.49        60.77

                Marital status of mother
                Never married/ Separated/
                Divorced / Widowed                 125         20,641        50.0         37.68        62.36
                Married/ Cohabiting                7,035      1,056,439      54.6         50.49        58.69
                Education of mother
                None                               131         20,569        51.5         40.11        62.82
                Primary                            801         123,222       54.4         47.49        61.12
                Secondary                          3,849       567,061       56.9         51.83        61.91
                Higher                             2,359       365,168       51.4         46.99        55.83

                Education of father
                None                               132         17,582        48.8         38.91        58.86
                Primary                            918         145,058       59.5         52.93        65.79
                Secondary                          3,870       566,401       56.2         51.97        60.35
                Higher                             1,948       301,626       51.4         44.89        57.77
                Occupation of mother
                Public Sector                      1,787       224,986       56.5         50.44        62.39
                Private Sector                     1,402       239,075       49.2         43.76        54.71
                Self-employed                      505         85,759        55.9         46.85        64.61
                Unemployed                         3,447       525,351       56.2         52.02        60.25

                Occupation of father
                Public Sector                      1,710       203,832       55.4         49.73        61.00
                Private Sector                     3,246       532,220       55.0         50.47        59.51
                Self-employed                      1,865       288,098       54.7         49.97        59.38
                Unemployed                          63         10,350        55.1         42.12        67.41
                Household income
                Less than RM1000                   856         138,065       60.0         53.76        65.98
                RM1000 – RM1999                    1,178       155,535       53.7         48.91        58.34
                RM2000 – RM2999                    1,253       171,797       57.3         51.69        62.76
                RM3000 – RM3999                    1,024       152,711       56.6         49.91        63.05
                RM4000 – RM4999                    705         99,051        51.1         42.98        59.09
                RM5000 and above                   2,194       381,786       52.7         46.65        58.68


               Some cells have respondent count <30. Results should be interpreted with caution.
   210   211   212   213   214   215   216   217   218   219   220