
Page 40 - MALAYSIAN BURDEN OF DISEASE AND INJURY STUDY, 2015-2017
P. 40
3.3.2 Pattern of Years of Life Lost (YLL) by age in 2017.
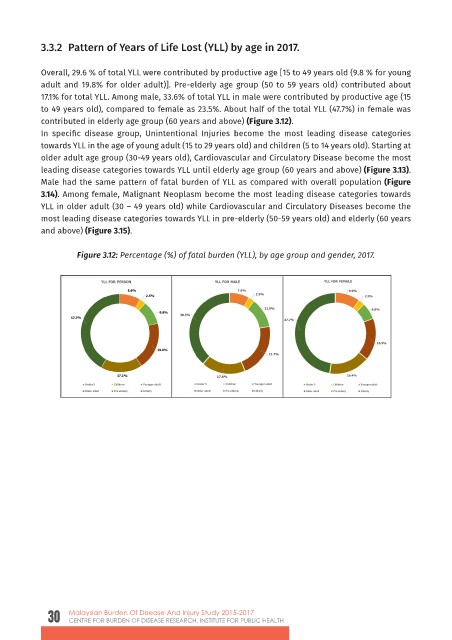
Overall, 29.6 % of total YLL were contributed by productive age [15 to 49 years old (9.8 % for young
adult and 19.8% for older adult)]. Pre-elderly age group (50 to 59 years old) contributed about
17.1% for total YLL. Among male, 33.6% of total YLL in male were contributed by productive age (15
to 49 years old), compared to female as 23.5%. About half of the total YLL (47.7%) in female was
contributed in elderly age group (60 years and above) (Figure 3.12).
In specific disease group, Unintentional Injuries become the most leading disease categories
towards YLL in the age of young adult (15 to 29 years old) and children (5 to 14 years old). Starting at
older adult age group (30-49 years old), Cardiovascular and Circulatory Disease become the most
leading disease categories towards YLL until elderly age group (60 years and above) (Figure 3.13).
Male had the same pattern of fatal burden of YLL as compared with overall population (Figure
become the most leading disease categories towards YLL until elderly age group (60 years
3.14). Among female, Malignant Neoplasm become the most leading disease categories towards
and above) (Figure 3.13). Male had the same pattern of fatal burden of YLL as compared
YLL in older adult (30 – 49 years old) while Cardiovascular and Circulatory Diseases become the
with overall population (Figure 3.14). Among female, Malignant Neoplasm become the most
most leading disease categories towards YLL in pre-elderly (50-59 years old) and elderly (60 years
leading disease categories towards YLL in older adult (30 – 49 years old) while Cardiovascular
and above) (Figure 3.15).
and Circulatory Diseases become the most leading disease categories towards YLL in pre-
elderly (50-59 years old) and elderly (60 years and above) (Figure 3.15).
Figure 3.12: Percentage (%) of fatal burden (YLL), by age group and gender, 2017.
Figure 3.12: Percentage (%) of fatal burden (YLL), by age group and gender, 2017.
Figure 3.13: Percentage (%) of fatal burden (YLL), by disease categories and age group,
person, 2017.
30 Malaysian Burden Of Disease And Injury Study 2015-2017
CENTRE FOR BURDEN OF DISEASE RESEARCH, INSTITUTE FOR PUBLIC HEALTH