
Page 32 - MALAYSIAN BURDEN OF DISEASE AND INJURY STUDY, 2015-2017
P. 32
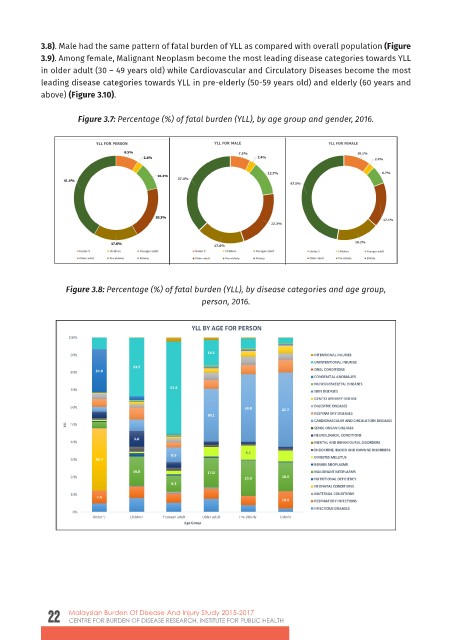
3.8). Male had the same pattern of fatal burden of YLL as compared with overall population (Figure
            3.9). Among female, Malignant Neoplasm become the most leading disease categories towards YLL
               and above) (Figure 3.8). Male had the same pattern of fatal burden of YLL as compared with
            in older adult (30 – 49 years old) while Cardiovascular and Circulatory Diseases become the most
               overall  population  (Figure 3.9).  Among  female,  Malignant  Neoplasm  become  the  most
                and above) (Figure 3.8). Male had the same pattern of fatal burden of YLL as compared with
            leading disease categories towards YLL in pre-elderly (50-59 years old) and elderly (60 years and
               leading disease categories towards YLL in older adult (30 – 49 years old) while Cardiovascular
                overall  population  (Figure 3.9).  Among  female,  Malignant  Neoplasm  become  the  most
               and Circulatory
            above) (Figure 3.10).  Diseases become the most leading disease categories towards YLL in pre-
                leading disease categories towards YLL in older adult (30 – 49 years old) while Cardiovascular
                and Circulatory Diseases become the most leading disease categories towards
               elderly (50-59 years old) and elderly (60 years and above) (Figure 3.10).          YLL in pre-
                elderly (50-59 years old) and elderly (60 years and above) (Figure 3.10).
                      Figure 3.7: Percentage (%) of fatal burden (YLL), by age group and gender, 2016.
               Figure 3.7: Percentage (%) of fatal burden (YLL), by age group and gender, 2016.
                Figure 3.7: Percentage (%) of fatal burden (YLL), by age group and gender, 2016.


               Figure 3.8: Percentage (%) of fatal burden (YLL), by disease categories and age group,
                  Figure 3.8: Percentage (%) of fatal burden (YLL), by disease categories and age group,
               person, 2016.
                Figure 3.8: Percentage (%) of fatal burden (YLL), by disease categories and age group,
                person, 2016.                         person, 2016.


                   Malaysian Burden Of Disease And Injury Study 2015-2017

              22    CENTRE FOR BURDEN OF DISEASE RESEARCH, INSTITUTE FOR PUBLIC HEALTH