
Page 30 - MALAYSIAN BURDEN OF DISEASE AND INJURY STUDY, 2015-2017
P. 30
3.2 Years of Life Lost (YLL) - 2016
3.2 Years of Life Lost (YLL) - 2016
3.2.1 Pattern of Years of Life Lost (YLL) by gender in 2016.
3.2.1 Pattern of Years of Life Lost (YLL) by gender in 2016.
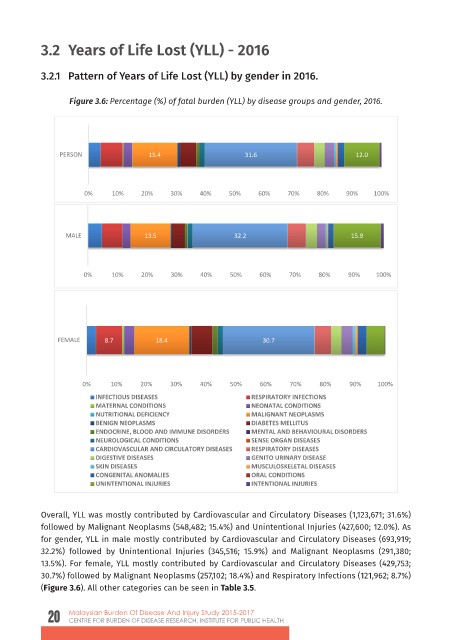
Figure 3.6: Percentage (%) of fatal burden (YLL) by disease groups and gender, 2016.
Figure 3.6: Percentage (%) of fatal burden (YLL) by disease groups and gender, 2016.
PERSON 15.4 31.6 12.0
0% 10% 20% 30% 40% 50% 60% 70% 80% 90% 100%
MALE 13.5 32.2 15.9
0% 10% 20% 30% 40% 50% 60% 70% 80% 90% 100%
FEMALE 8.7 18.4 30.7
0% 10% 20% 30% 40% 50% 60% 70% 80% 90% 100%
INFECTIOUS DISEASES RESPIRATORY INFECTIONS
MATERNAL CONDITIONS NEONATAL CONDITIONS
NUTRITIONAL DEFICIENCY MALIGNANT NEOPLASMS
BENIGN NEOPLASMS DIABETES MELLITUS
ENDOCRINE, BLOOD AND IMMUNE DISORDERS MENTAL AND BEHAVIOURAL DISORDERS
NEUROLOGICAL CONDITIONS SENSE ORGAN DISEASES
CARDIOVASCULAR AND CIRCULATORY DISEASES RESPIRATORY DISEASES
DIGESTIVE DISEASES GENITO URINARY DISEASE
SKIN DISEASES MUSCULOSKELETAL DISEASES
CONGENITAL ANOMALIES ORAL CONDITIONS
UNINTENTIONAL INJURIES INTENTIONAL INJURIES
Overall, YLL was mostly contributed by Cardiovascular and Circulatory Diseases (1,123,671;
Overall, YLL was mostly contributed by Cardiovascular and Circulatory Diseases (1,123,671; 31.6%)
31.6%) followed by Malignant Neoplasms (548,482; 15.4%) and Unintentional Injuries
followed by Malignant Neoplasms (548,482; 15.4%) and Unintentional Injuries (427,600; 12.0%). As
(427,600; 12.0%). As for gender, YLL in male mostly contributed by Cardiovascular and
for gender, YLL in male mostly contributed by Cardiovascular and Circulatory Diseases (693,919;
Circulatory Diseases (693,919; 32.2%) followed by Unintentional Injuries (345,516; 15.9%)
32.2%) followed by Unintentional Injuries (345,516; 15.9%) and Malignant Neoplasms (291,380;
and Malignant Neoplasms (291,380; 13.5%). For female, YLL mostly contributed by
13.5%). For female, YLL mostly contributed by Cardiovascular and Circulatory Diseases (429,753;
Cardiovascular and Circulatory Diseases (429,753; 30.7%) followed by Malignant Neoplasms
30.7%) followed by Malignant Neoplasms (257,102; 18.4%) and Respiratory Infections (121,962; 8.7%)
(Figure 3.6). All other categories can be seen in Table 3.5.
20 Malaysian Burden Of Disease And Injury Study 2015-2017
CENTRE FOR BURDEN OF DISEASE RESEARCH, INSTITUTE FOR PUBLIC HEALTH