
Page 23 - MALAYSIAN BURDEN OF DISEASE AND INJURY STUDY, 2015-2017
P. 23
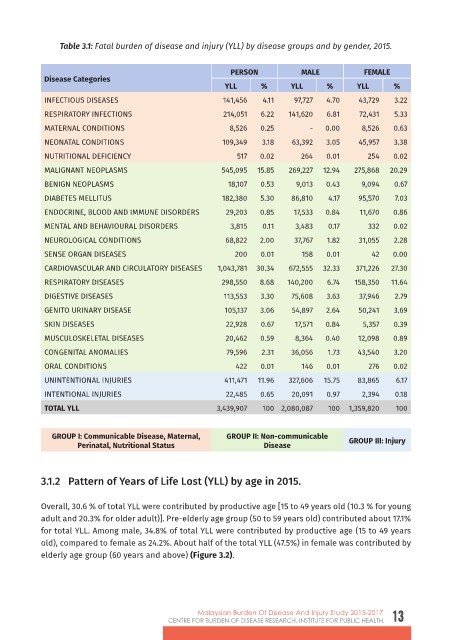
Table 3.1: Fatal burden of disease and injury (YLL) by disease groups and by gender, 2015.


                                                              PERSON            MALE             FEMALE
             Disease Categories
                                                            YLL       %       YLL      %       YLL       %
             INFECTIOUS DISEASES                            141,456   4.11    97,727   4.70     43,729   3.22
             RESPIRATORY INFECTIONS                         214,051   6.22   141,620   6.81     72,431   5.33
             MATERNAL CONDITIONS                              8,526   0.25         -   0.00     8,526    0.63
             NEONATAL CONDITIONS                            109,349   3.18    63,392   3.05    45,957    3.38

             NUTRITIONAL DEFICIENCY                            517    0.02      264    0.01       254    0.02
             MALIGNANT NEOPLASMS                           545,095   15.85   269,227  12.94   275,868   20.29
             BENIGN NEOPLASMS                                18,107   0.53     9,013   0.43     9,094    0.67

             DIABETES MELLITUS                             182,380    5.30    86,810   4.17    95,570    7.03
             ENDOCRINE, BLOOD AND IMMUNE DISORDERS           29,203   0.85    17,533   0.84     11,670   0.86
             MENTAL AND BEHAVIOURAL DISORDERS                 3,815   0.11     3,483   0.17       332    0.02
             NEUROLOGICAL CONDITIONS                        68,822    2.00     37,767  1.82    31,055    2.28

             SENSE ORGAN DISEASES                              200    0.01      158    0.01        42    0.00
             CARDIOVASCULAR AND CIRCULATORY DISEASES      1,043,781  30.34   672,555  32.33    371,226  27.30
             RESPIRATORY DISEASES                          298,550   8.68    140,200   6.74   158,350   11.64

             DIGESTIVE DISEASES                             113,553   3.30    75,608   3.63     37,946   2.79
             GENITO URINARY DISEASE                         105,137   3.06    54,897   2.64    50,241    3.69
             SKIN DISEASES                                   22,928   0.67     17,571  0.84      5,357   0.39

             MUSCULOSKELETAL DISEASES                       20,462    0.59     8,364   0.40    12,098    0.89
             CONGENITAL ANOMALIES                            79,596   2.31    36,056   1.73    43,540    3.20
             ORAL CONDITIONS                                   422    0.01      146    0.01       276    0.02

             UNINTENTIONAL INJURIES                         411,471  11.96   327,606  15.75    83,865    6.17
             INTENTIONAL INJURIES                            22,485   0.65    20,091   0.97     2,394    0.18

             TOTAL YLL                                    3,439,907   100 2,080,087    100   1,359,820   100


               GROUP I: Communicable Disease, Maternal,      GROUP II: Non-communicable      GROUP III: Injury
                     Perinatal, Nutritional Status                    Disease


            3.1.2   Pattern of Years of Life Lost (YLL) by age in 2015.


            Overall, 30.6 % of total YLL were contributed by productive age [15 to 49 years old (10.3 % for young
            adult and 20.3% for older adult)]. Pre-elderly age group (50 to 59 years old) contributed about 17.1%
            for total YLL. Among male, 34.8% of total YLL were contributed by productive age (15 to 49 years
            old), compared to female as 24.2%. About half of the total YLL (47.5%) in female was contributed by
            elderly age group (60 years and above) (Figure 3.2).


                                                     Malaysian Burden Of Disease And Injury Study 2015-2017
                                             CENTRE FOR BURDEN OF DISEASE RESEARCH, INSTITUTE FOR PUBLIC HEALTH  13