Page 245 - nhms2016 maternal and child findings
P. 245

231
                                                National Health And Morbidity Survey 2016 : Maternal And Child Health (MCH)  Volume II : Findings


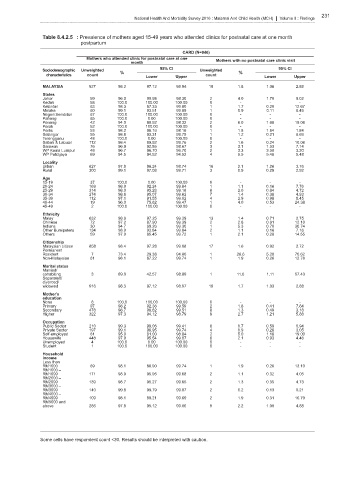
                Table 8.4.2.5 : Prevalence of mothers aged 15-49 years who attended clinics for postnatal care at one month
                             postpartum
                                                                 CARD (N=946)
                               Mothers who attended clinic for postnatal care at one  Mothers with no postnatal care clinic visit
                                               month
                Sociodemographic  Unweighted             95% CI        Unweighted                  95% CI
                 characteristics  count    %                             count       %
                                                    Lower      Upper                          Lower     Upper
                MALAYSIA        927        98.2      97.12     98.94      19         1.8       1.06      2.88
                States
                Johor            59        96.0      90.98     98.30       2         4.0       1.70      9.02
                Kedah            58       100.0     100.00     100.00      0         -          -         -
                Kelantan         63        98.3      87.33     99.80       1         1.7       0.20      12.67
                Melaka           60        99.1      93.51     99.89       1         0.9       0.11      6.49
                Negeri Sembilan  67       100.0     100.00     100.00      0         -          -         -
                Pahang           65       100.0      0.00      100.00      0         -          -         -
                Penang           42        94.0      80.92     98.32       2         6.0       1.68      19.08
                Perak            52       100.0     100.00     100.00      0         -          -         -
                Perlis           53        98.2      98.16     98.16       1         1.8       1.84      1.84
                Selangor         55        98.8      93.31     99.79       1         1.2       0.21      6.69
                Terengganu       48       100.0      0.00      100.00      0         -          -         -
                Sabah & Labuan  112        98.4      89.92     99.76       2         1.6       0.24      10.08
                Sarawak          76        96.9      92.86     98.67       3         3.1       1.33      7.14
                WP Kuala Lumpur  48        96.7      96.70     96.70       2         3.3       3.30      3.30
                WP Putrajaya     69        94.5      94.52     94.52       4         5.5       5.48      5.48
                Locality
                Urban           627        97.8      96.24     98.74      16         2.1       1.26      3.76
                Rural           300        99.1      97.08     99.71       3         0.9       0.29      2.92
                Age
                15-19            37       100.0      0.00      100.00      0         -          -         -
                20-24           169        98.9      92.24     99.84       1         1.1       0.16      7.76
                25-29           314        98.0      95.28     99.16       6         2.0       0.84      4.72
                30-34           274        98.6      95.07     99.62       7         1.4       0.38      4.93
                35-39           112        97.1      91.55     99.02       4         2.9       0.98      8.45
                40-44            19        96.0      75.62     99.47       1         4.0       0.53      24.38
                45-49            2        100.0     100.00     100.00      0         -          -         -
                Ethnicity
                Malay           632        98.6      97.25     99.29      13         1.4       0.71      2.75
                Chinese          72        97.2      87.90     99.39       2         2.8       0.61      12.10
                Indians          30        94.7      69.26     99.30       1         5.3       0.70      30.74
                Other Bumiputera  134      98.9      92.84     99.84       2         1.1       0.16      7.16
                Others           59        97.9      85.45     99.72       1         2.1       0.28      14.55
                Citizenship
                Malaysian citizen  858     98.4      97.28     99.08      17         1.6       0.92      2.72
                Permanent
                Resident         7         73.4      29.38     94.80       1        26.6       5.20      70.62
                Non-Malaysian    61        98.1      87.22     99.74       1         1.9       0.26      12.78
                Marital status
                Married/
                cohabiting       3         89.0      42.57     98.89       1        11.0       1.11      57.43
                Separated/
                divorced/
                widowed         916        98.3      97.12     98.97      18         1.7       1.03      2.88
                Mother's
                education
                None             8        100.0     100.00     100.00      0         -          -         -
                Primary          97        98.2      92.36     99.59       2         1.8       0.41      7.64
                Secondary       478        98.7      96.82     99.51       8         1.3       0.49      3.18
                Higher          322        97.3      94.12     98.79       9         2.7       1.21      5.88
                Occupation
                Public Sector   210        99.3      99.06     99.41       6         0.7       0.59      0.94
                Private Sector  197        99.1      96.95     99.74       4         0.9       0.26      3.05
                Self-employed    61        95.0      81.00     98.84       2         5.0       1.16      19.00
                Housewife       448        97.9      95.54     99.07       6         2.1       0.93      4.46
                Unemployed       4        100.0      0.00      100.00      0         -          -         -
                Student          1        100.0     100.00     100.00      0         -          -         -
                Household
                income
                Less than
                RM1000           69        98.1      86.90     99.74       1         1.9       0.26      13.10
                RM1000 –
                RM1999          171        98.9      95.95     99.68       2         1.1       0.32      4.05
                RM2000 –
                RM2999          139        98.7      95.27     99.65       2         1.3       0.35      4.73
                RM3000 –
                RM3999          140        99.8      99.79     99.87       2         0.2       0.13      0.21
                RM4000 –
                RM4999          109        98.1      89.21     99.69       2         1.9       0.31      10.79
                RM5000 and
                above           286        97.8      95.12     99.00       9         2.2       1.00      4.88


               Some cells have respondent count <30. Results should be interpreted with caution.
   240   241   242   243   244   245   246   247   248   249   250