
Page 235 - nhms2016 maternal and child findings
P. 235
221
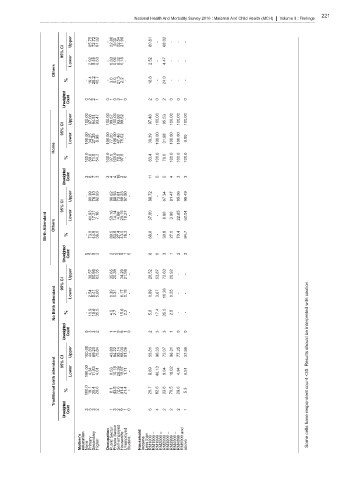
National Health And Morbidity Survey 2016 : Maternal And Child Health (MCH) Volume II : Findings
Upper - 65.75 72.72 91.02 - 22.80 0.00 52.54 21.98 - 60.61 - 68.02 - - -
95% CI Lower - 2.92 5.49 6.53 - 0.33 0.00 6.32 0.18 - 2.52 - 4.47 - - -
Others
% - 19.4 28.2 45.7 - 3.0 0.0 21.5 2.2 - 16.6 - 24.0 - - -
Unw eig h ted Cou n t 0 2 2 1 0 1 0 3 1 0 2 0 2 0 0 0
Upper 100.00 97.08 94.51 93.47 100.00 99.67 100.00 93.68 99.82 - 97.48 100.00 95.53 100.00 100.00 100.00
95% CI
Lower 100.00 34.25 27.28 8.98 100.00 77.20 100.00 47.46 78.02 - 39.39 100.00 31.98 100.00 100.00 0.00
Home
% 100.0 80.6 71.8 54.3 100.0 97.0 100.0 78.5 97.8 - 83.4 100.0 76.0 100.0 100.0 100.0
Unw eig h ted Cou n t 3 8 7 3 3 4 4 18 2 0 11 5 5 4 3 3
Upper - 90.99 76.10 82.93 98.62 88.93 73.61 69.23 97.90 - 88.72 - 67.34 81.47 95.06 99.49
95% CI Lower - 41.93 17.31 7.16 50.16 14.14 4.86 20.19 18.27 - 37.80 - 8.80 3.00 22.65 62.04
Birth Attendant Others % - 73.0 44.9 38.0 89.5 53.5 27.4 43.0 76.3 - 68.6 - 30.8 27.0 70.4 94.7
Un w e i g h te d Co un t 0 5 5 2 2 2 2 9 1 0 6 0 3 1 2 3
Upper - 36.57 50.98 83.35 35.65 20.39 - 34.29 21.98 - 28.52 53.87 72.63 20.92 - -
95% CI Lower 2.54 5.41 5.68 0.39 0.31 6.17 0.18 0.89 3.67 10.28 0.25 caution.
No Birth attendant % - - 10.9 19.6 35.5 4.5 2.7 - - 15.6 2.2 - - 5.6 17.4 35.5 2.5 - - - - with
U n w e i g h te d Co un t 0 3 3 2 1 1 0 6 1 0 2 3 3 1 0 0 interpreted be
Upper 100.00 44.83 69.20 75.84 43.80 84.22 95.14 68.00 81.06 - 55.81 96.33 72.07 96.31 77.35 37.96 should Results
95% CI
Traditional birth attendant % Lower 100.00 100.0 16.1 4.34 11.83 35.4 4.01 26.6 0.53 6.1 10.18 43.8 26.39 72.6 41.4 18.97 21.4 1.71 - - 8.69 25.7 82.6 46.13 9.04 33.6 18.02 70.5 29.6 4.94 0.51 5.3 <30. count
Un w e i g h te d Co un t 3 3 3 2 1 3 2 9 1 0 5 4 2 2 2 1 respondent
have cells
Mother's education None Primary Secondary Higher Occupation Public Sector Private Sector Self-employed Housewife Unemployed Student Household income Less than RM1000 – RM1000 RM1999 – RM2000 RM2999 – RM3000 RM3999 – RM4000 RM4999 and RM5000 above Some