
Page 234 - nhms2016 maternal and child findings
P. 234
220
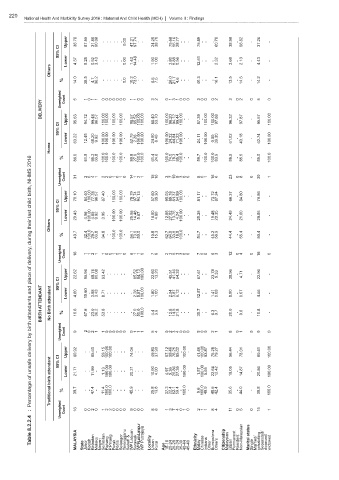
National Health And Morbidity Survey 2016 : Maternal And Child Health (MCH) Volume II : Findings
Upper 36.78 87.55 - 31.80 90.08 - - - - - - 0.00 47.21 97.74 - - 24.20 38.70 - 75.68 55.16 28.77 - - - 75.89 - - - 60.70 38.98 - 56.82 - 37.26 -
95% CI Lower 4.37 5.28 - 0.52 3.43 - - - - - - 0.00 1.43 14.48 - - 1.50 1.00 - 3.80 5.88 0.56 - - - 12.61 - - - 2.32 3.68 - 2.13 - 4.43 -
Others
% 14.0 38.5 - 4.7 36.2 - - - - - - 0.0 10.2 73.0 - - 6.5 7.5 - 26.0 21.7 4.6 - - - 40.3 - - - 16.1 13.5 - 14.5 - 14.2 -
DELIVERY Unweighted Count Upper 5 95.63 1 94.72 0 - 1 99.48 1 96.57 0 100.00 0 100.00 0 - 0 100.00 0 - 0 100.00 0 - 1 98.57 1 85.52 0 100.00 0 100.00 3 88.40 2 53.70 0 100.00 1 96.20 3 94.12 1 99.44 0 100.00 0 - 0 - 3 87.39 0 - 0 100.00 0 100.00 2 97.68 3 96.32 0 - 2 97.87 0 - 5 95.57 0 100.00
95% CI
Lower 63.22 12.45 - 68.20 9.92 100.00 100.00 - 100.00 - 100.00 - 52.79 2.26 100.00 100.00 24.90 8.40 100.00 24.32 44.84 71.23 100.00 - - 24.11 - 100.00 0.00 39.30 61.02 - 43.18 - 62.74 100.00
Home
2016 % 86.0 61.5 - 95.3 63.8 100.0 100.0 - 100.0 - 100.0 - 89.8 27.0 100.0 100.0 61.4 24.6 100.0 74.0 78.3 95.4 100.0 - - 59.7 - 100.0 100.0 83.9 86.5 - 85.5 - 85.8 100.0
NHMS Unweighted Count 31 2 0 4 1 2 2 0 1 0 1 0 14 1 2 1 15 16 3 7 10 8 3 0 0 8 0 1 16 6 23 0 8 0 30 1
birth, Upper 70.10 84.40 100.00 77.78 96.57 87.40 - - 100.00 - 100.00 - 79.79 97.74 94.13 - 57.60 39.30 95.03 89.78 61.37 54.89 100.00 - - 81.17 - - 73.72 87.24 66.37 - 84.80 - 70.86 -
child 95% CI
last Lower 29.43 4.06 100.00 4.85 9.92 3.95 - - 100.00 - 100.00 - 25.96 14.48 5.87 - 16.90 4.80 12.88 27.82 13.76 4.24 100.00 - - 25.26 - - 19.48 20.35 24.49 - 21.60 - 29.86 -
their Others
during % 49.7 32.4 100.0 29.7 63.8 34.8 - - 100.0 - 100.0 - 54.1 73.0 50.0 - 10.8 15.3 62.7 64.8 33.5 18.8 100.0 - - 54.7 - - 45.2 56.9 44.4 - 55.4 - 50.4 -
delivery, Unweighted Count 16 1 1 2 1 1 0 0 1 0 1 0 6 1 1 0 7 9 2 3 5 3 3 0 0 7 0 0 6 3 12 0 4 0 16 0
of
place 95% CI Upper 22.62 95.94 - 68.74 90.08 93.42 - - - - - - - 85.52 94.13 100.00 22.60 13.20 - 45.51 41.46 54.32 - - - 67.61 - - 23.78 5.33 38.96 - 4.71 - 22.96 -
and Lower 4.60 15.60 - 3.88 3.43 8.71 - - - - - - - 2.26 5.87 100.00 1.80 1.00 - 2.54 3.87 6.13 - - - 12.87 - - 1.41 0.08 8.90 - 0.07 - 4.66 -
attendants BIRTH ATTENDANT No Birth attendant % 10.6 67.6 - 23.0 36.2 53.8 - - - - - - - 27.0 50.0 100.0 4.4 3.9 - 12.8 14.5 21.8 - - - 35.7 - - 6.3 0.7 20.0 - 0.6 - 10.8 -
birth
by Unweighted Count 9 2 0 2 1 1 0 0 0 0 0 0 0 1 1 1 5 4 0 2 3 4 0 0 0 5 0 0 2 1 8 0 1 0 9 0
delivery Upper 60.92 - - 85.60 - 59.15 100.00 100.00 - - - - 74.04 - - - 49.80 37.90 87.12 59.46 76.25 85.02 - 100.00 - 41.46 100.00 93.87 75.28 79.27 56.44 - 78.01 - 60.41 100.00
unsafe 95% CI Lower 21.71 - - 11.99 - 1.13 100.00 100.00 - - - - 20.21 - - - 10.90 4.00 4.97 5.36 26.86 27.35 - 100.00 - 1.57 100.00 5.65 22.64 12.42 19.05 - 14.87 - 20.86 100.00
of Traditional birth attendant
Percentage % 39.7 - - 47.4 - 11.4 100.0 100.0 - - - - 45.9 - - - 25.8 13.8 37.3 22.4 52.1 59.4 - 100.0 - 9.6 100.0 48.9 48.6 42.4 35.6 - 44.0 - 38.8 100.0
: Unweighted Count 16 0 0 2 0 1 2 2 0 0 0 0 9 0 0 0 8 8 1 3 7 4 0 1 0 2 1 1 8 4 11 0 5 0 15 1
8.2.2.4
Table MALAYSIA State Johor Kedah Kelantan Melaka Negeri Sembilan Pahang P.Pinang Perak Perlis Selangor Terengganu Sabah & WP Labuan Sarawak WPKualaLumpur WP Putrajaya Locality Urban Rural Age 15-19 20-24 25-29 30-34 35-39 40-44 45-49 Ethnicity Malay Chinese Indians Other Bumiputera Others Citizenship Malaysian citizen Permanent Resident Non-Malaysian Marital status Single Married/ cohabiting Separated/