
Page 178 - nhms2016 maternal and child findings
P. 178
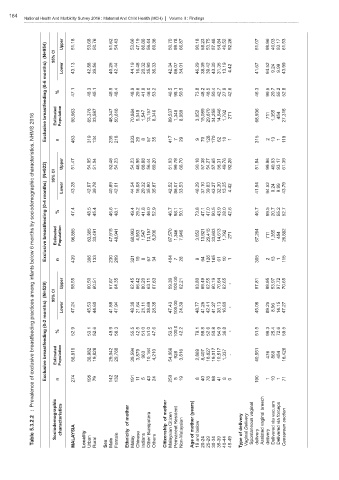
164
          National Health And Morbidity Survey 2016 : Maternal And Child Health (MCH)  Volume II : Findings


                 (N=954)  95% CI  Upper  51.18  53.68  50.76  51.62  54.43  53.66  47.19  66.88  56.44  69.36  50.70  99.78  66.87  90.18  58.23  53.75  57.48  54.84  49.52  92.26  51.07  99.96  40.03  93.17  61.53


                 months)  Lower  43.13  42.88  39.56  40.25  42.44  44.19  16.48  20.32  35.90  36.33  42.34  86.07  34.01  46.29  38.39  39.42  43.30  31.35  13.19  4.42  41.67  94.52  9.24  9.99  43.99


                 (0-6  %   47.1  48.3  45.1  45.9  48.4  48.9  29.6  41.8  46.0  53.2  46.5  98.1  50.5  73.8  48.2  46.5  50.4  42.7  27.9  42.6  46.3  99.5  20.7  55.2  52.8
                 breastfeeding


             2016    Estimated  Population  98,963  65,376  33,587  48,347  50,616  70,864  5,049  1,547  13,157  8,346  89,537  1,346  8,080  3,052  15,089  29,670  34,255  14,646  1,792  271  68,936  711  1,355  454  27,318

             NHMS  Exclusive  n  453  319  134  235  218  333  20  8  57  35  417  7  29  9  70  128  170  62  10  1  315  2  13  1  119

             characteristics,  (N=922)  95% CI  Upper  51.47  54.05  51.04  52.46  54.23  54.23  46.95  66.88  56.44  69.20  51.03  99.78  66.70  90.18  57.38  54.27  57.65  56.31  49.76  92.26  51.54  99.96  40.03  93.17  61.39


             sociodemographic  months)  (0-4  Lower  43.28  42.97  39.78  40.89  42.01  44.54  16.08  20.32  35.90  35.87  42.52  86.07  33.53  46.29  37.10  39.83  43.27  32.30  13.25  4.42  41.94  94.52  9.24  9.99  43.79


             by  breastfeeding  %  47.4  48.5  45.4  46.6  48.1  49.4  29.2  41.8  46.0  52.9  46.7  98.1  50.1  73.8  47.1  47.0  50.5  43.9  28.0  42.6  46.7  99.5  20.7  55.2  52.7
             months  Estimated  Population  96,855  63,365  33,491  47,915  48,941  68,993  4,953  1,547  13,157  8,206  87,570  1,346  7,940  3,052  13,921  29,415  33,603  14,613  1,792  271  67,264  711  1,355  454  26,882


             6   Exclusive
             below    n    439   306  133  230  209  321  19  8  57  34  404  7  28  9  64  126  165  61  10  1  305  2  13  1  115

             infants


             among  (N=529)  95% CI  Upper  58.55  60.50  60.51  57.87  64.35  62.45  66.42  80.20  63.11  67.63  59.39  100.00  62.21  93.80  69.49  62.55  60.19  70.64  62.65  -  57.81  99.95  53.97  97.72  70.65


             practices  months)  Lower  47.24  45.53  44.60  41.85  47.94  48.38  21.64  21.11  38.69  28.35  47.43  100.00  24.39  48.77  41.25  42.41  41.27  38.13  16.80  -  45.08  89.25  8.96  14.15  47.27


             breastfeeding  (0-2 breastfeeding  %  52.9  53.1  52.6  49.9  56.3  55.5  42.5  51.0  51.0  47.6  53.5  100.0  42.2  79.1  55.8  52.6  50.8  54.9  36.8  -  51.5  99.3  25.4  72.6  59.5


             exclusive  Exclusive  Estimated  Population  58,810  38,982  19,828  29,042  29,768  39,594  3,879  963  10,164  4,210  54,066  928  3,816  2,869  8,407  16,627  19,017  10,517  1,337  -  40,551  476  868  454  16,426


             of       n    274   195  79  142  132  191  11  5  43  24  250  5  19  8  40  78  98  41  8  0  190  1  10  1  71
             Prevalence


             :                                mother       mother  Resident  (years)      vaginal  breech  vacuum  forceps  section
             5.3.2.2  Sociodemographic  characteristics  of  Bumiputera  of  Citizen  mother  below  delivery  Delivery  Spontaneous  vaginal  via  via


             Table         MALAYSIA  Locality  Urban  Rural  Sex  Male  Female  Ethnicity  Malay  Chinese  Indians  Other  Others  Citizenship  Malaysian  Permanent  Non-Malaysian  of  Age  and  19  20-24  25-29  30-34  35-39  40-44  45-49  of  Type  Vaginal  delivery  Assisted  delivery  Delivered  Delivered  Caesarean