
Page 10 - WELFARE IN MALAYSIA ACROSS THREE DECADES: THE STATE OF HOUSEHOLDS 2020 PART 1
P. 10
EXECUTIVE SUMMARY
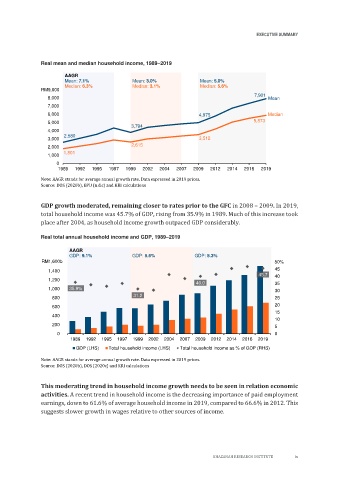
Real mean and median household income, 1989–2019
AAGR
Mean: 7.1% Mean: 3.0% Mean: 5.0%
Median: 6.3% Median: 3.1% Median: 5.6%
9,000
RM9,000
7,901
8,000 Mean
7,000
6,000 4,975 Median
5,000 5,873
3,794
4,000
2,580
3,000 3,512
2,000 2,615
1,801
1,000
0
1989 1992 1995 1997 1999 2002 2004 2007 2009 2012 2014 2016 2019
Note: AAGR stands for average annual growth rate. Data expressed in 2019 prices.
Source: DOS (2020b), EPU (n.d.c) and KRI calculations
GDP growth moderated, remaining closer to rates prior to the GFC in 2008 – 2009. In 2019,
total household income was 45.7% of GDP, rising from 35.9% in 1989. Much of this increase took
place after 2004, as household income growth outpaced GDP considerably.
Real total annual household income and GDP, 1989–2019
AAGR
GDP: 9.1% GDP: 5.6% GDP: 5.3%
RM1,600b 50%
50
1,600.0
1,400.0 45
45.7 40
1,200.0
40.0 35
1,000.0 35.9% 30
31.2
800.0 25
600.0 20
15
400.0
10
200.0 5
0.0 0
1989 1992 1995 1997 1999 2002 2004 2007 2009 2012 2014 2016 2019
GDP (LHS) Total household income (LHS) Total household income as % of GDP (RHS)
Note: AAGR stands for average annual growth rate. Data expressed in 2019 prices.
Source: DOS (2020b), DOS (2020c) and KRI calculations
This moderating trend in household income growth needs to be seen in relation economic
activities. A recent trend in household income is the decreasing importance of paid employment
earnings, down to 61.6% of average household income in 2019, compared to 66.6% in 2012. This
suggests slower growth in wages relative to other sources of income.
KHAZANAH RESEARCH INSTITUTE ix